冷眼分享集 "投资者所犯的最大错误,是他相信自己可以应用各种既艰深,又复杂的方法去战胜股市,从而赚取暴利。实际上,这一类投资者,成功致富的少之又少,真正成功的反而是那些根据很简单的准则进行投资,而动作又很少的投资者。"
Thursday, September 30, 2010
I have to quit drinking Coke and how to quit
Here is a list of 5 top reasons why you should just quit drinking Coca-Cola soda drinks and diet soda.
1. Counteractive to Weight Loss Efforts.
Diet Coke should be a diet staple when I was trying to lose weight, which I later I found out wasn’t the case at all. Diet soda has been found to increase possibility of weight gain by 41%.
2. Stains and corrodes your teeth.
Coca-Cola and sodas with colorings stain your teeth, as many are already aware. In addition, they have been shown to destroy 10 times more teeth material than fruit juices in just the first three minutes of drinking in a test
3. Limited hydration.
Coke and soft drinks contain caffeine, which is a diuretic. A diuretic is a drug that speeds up the rate of urine production – meaning it removes water from your body.
4. Artificial stimulant which alters your mind.
Caffeine is also a psychoactive stimulant drug. It affects the central nervous system and alters brain function, resulting in temporary changes in perception, mood, consciousness and behavior
5. Causes insomnia and sleeping disorders.
How To Quit Drinking Coke / Sodas Successfully
1. Identify a substitute drink (that’s healthier).
2. Get rid of the soda drinks in the fridge.
It may seem like a waste but it’s better than downing them into your body and ruining it.
3. And stop buying them home
4. Mentally block out the soda section in the menu when you dine outside
5. Tell Your friend your plan
6. Ensure you have enough sleep
7. Keep a record of the days you go without drinking Coke or sodas
8. Persevere. As you start cutting away Coke and sodas from your life, you may find withdrawal symptoms in the first week (depending on how heavy a drinker you were before). These symptoms may come in the form of restlessness, anxiety, cravings to drink again.
Friday, September 24, 2010
李财有方:投机投资·见仁见智
Number in Thousand
Rev 2009
239,272,000
NP
16,759,000
eps = 3.22
price = 53
Rev 2008
Dec 31, 2008
367,053,000
NP
21,666,000
eps = 4.14
price = 38
Rev 2007
Dec 31, 2007
284,365,000
NP
21,169,000
eps = 4.07
Price = 63
2006
price = 64
2005
price = 67
以下就是我的小小功课:
美国总统奥巴马要求英国石油拿出200亿美元(648亿令吉)作为这起灾难的准备金,200亿美元是多大的数目呢?世界首富比尔盖茨的身家是500亿美元(1620亿令吉),所以英国石油要拿出的初步赔偿金大约是首富的四成身家。漏油事件发生在2010年4月20日,当天英国石油的股价是60美元(194.40令吉),市值是1900亿美元(6156亿令吉),1900亿美元是多大的数目呢?
今天整个大马股市的市值大约是3000亿美元(9720亿令吉),所以英国石油相等于三分之二的大马股市。
危机还是机会
今天(29/6 /10)英国石油的股价是27美元(87.48令吉),市值大约是850亿美元(2754亿令吉),短短的两个多月已经蒸发了1050亿美元(3402亿令吉),单单一个油井的意外就造成这么严重的损失,这个危机是危险还是机会呢?
先看危险:
这起漏油事件已经发生了两个多月,到目前专家们还是束手无策,无法把那个漏油洞口堵塞,英国石油说,这期间它已经花费了30亿美元(97.2亿令吉)的费用来抢救和清洗,而且这笔费用还与日俱增,看到这种烧钞票的速度,股东们都心寒了,怪不得它的股价会跌到这么的恐怖,真的是深不见底。
评估机构已经把它的债券评级下调至BBB级,差一点就掉入垃圾债券的等级了。
再看机会:
去年英国石油的净利是200亿美元(648亿令吉),派息100亿美元(324亿令吉)。看到这数据就我才恍然大悟,怪不得它这么爽快,一口气就答应奥巴马,它会拿出200亿美元作为赔偿准备金,原来这笔钱一年之内就可以赚回来了!
世界杯已经接近尾声了,赌球执照风波也暂告一段落,不管赌球有没有合法,要赌的人始终会找到门路,谁也阻止不了。
股汇市大赌场
有人说,股汇市就是最大的赌场,只要你牵涉在里面随时都要准备赌一手,假设你是英国石油的小股东,今天你面对的就是这样的局面。有人辞官归故里,有人漏夜赶科场,有人惊慌抛售就有人趁低吸购,希腊危机还没有解决,漏油事件又是一个危机,这是危机中的危机。投机投资,见仁见智,不管喜欢不喜欢,总之,你就是不能忽略它,因为股汇市就是投资乐园,也是冒险家的乐园。
Thursday, September 23, 2010
PBA Berhad
Mistakes Trades, Swap Trades
Monday, September 20, 2010
Allianz
Trading Buy : Supermx Review for 2nd quarter
Q2 revenue 234 825
Net profit 45,856
Net Profit Margin = 19.5%
EPS 13.51
Share Issue 339,423
Cash per share 83184 / 339423 = 0.24
Debt per share = 0.899
Inventories per share = 0.346
Net TR per share = TR-TP /Share issue = 0.55
Receivable Turn Over Ratio = ( TR /Revenue x 365 )/4
= 245227 / 234825
= 95days
TR 230,952
OTR 14,257
Cash 83184
Inventories 117272
Reserve increse frm 424710 to 482278
Long term Borrowing 163,632
Shorterm 141652
Trade payables 41,443
Betting on rebound.
FA = OK , Valuation quite good. most conservative calculation, eps 52 whole year ,PE only 8.36 as compare to pe 15 industry average. US Decision to approve medical restructuring will boost glove sector
Impact on Ringgit = from 3.3 to 3.1 riggit appreciate 6% thus reduce 6% of earnings. No problem to its high profit margin 19%. After riggint appreciate still able to make 13% due to its high profit margin , still a value buy.
Short Term trending from 20 to 21/9/2010
Price 4.35 to 4.30
RSI 24.96 oversold to RSI 40.25
%K > %D a little bit
Buying based on Price dropping from 5.48 after dilution to 4.35, 20% dropping.
EPF is buying at 5.47 @19/8 , 5.07 @ 25/8 , 4.83 7/9, 4.64 8/9, 4.83 9/9, 4.81 14/9
Cutloss at 11% @ 3.88
Disclaimer:These content provided is solely for education and information purposes only, and do not suggest any investment advices.
Tuesday, September 14, 2010
Stochastic Oscillator
Question? What are the parameters should set for stochastics oscillators?
EMA3(%D − Slow) is a 3-period exponential moving average of %D.
A 3-line Stochastics will give you an anticipatory signal in %K, a signal in the turnaround of %D at or before a bottom, and a confirmation of the turnaround in %D-Slow. [3] Typical values for N are 5, 9, or 14 periods. Smoothing the indicator over 3 periods is standard.
The signal to act is when you have a divergence-convergence, in an extreme area, with a crossover on the right hand side, of a cycle bottom.
Stochastics attempts to predict turning points by comparing the closing price of a security to its price range. Prices tend to close near the extremes of the recent range just before turning points. In the case of an uptrend, prices tend to make higher highs, and the settlement price usually tends to be in the upper end of that time period's trading range. When the momentum starts to slow, the settlement prices will start to retreat from the upper boundaries of the range, causing the stochastic indicator to turn down at or before the final price high.
An alert or set-up is present when the %D line is in an extreme area and diverging from the price action. The actual signal takes place when the faster % K line crosses the % D line.
Divergence-convergence is an indication that the momentum in the market is waning衰退 and a reversal may be in the making. The chart below illustrates an example of where a divergence in stochastics relative to price forecasts a reversal in the price's direction. Please see Chart 1
This is when prices pop through and keep on going - that is, break out.
Rules to follow:
Increase long position — When price crosses the upper band from below. RSI <50,k%>D%
Increase short position — When price crosses the lower band from above. RSI >70,D%>k%
Liquidate position — When Stochastic %D crosses %K in direction reversed to open trade
RSI
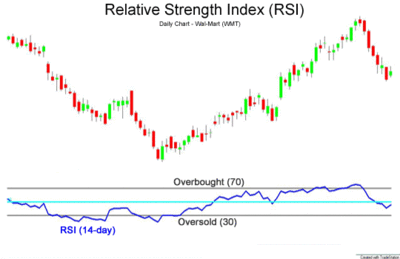
The Relative Strength Index (RSI) is a technical indicator used in the technical analysis of financial markets. It is intended to chart the current and historical strength or weakness of a stock or market based on the closing prices of a recent trading period. (It is not to be confused with relative strength.)
The RSI is classified as a momentum oscillator, measuring the velocity and magnitude of directional price movements. Momentum is the rate of the rise or fall in price. The RSI computes momentum as the ratio of higher closes to lower closes: stocks which have had more or stronger positive changes have a higher RSI than stocks which have had more or stronger negative changes.
The RSI is most typically used on a 14 day timeframe, measured on a scale from 0 to 100, with high and low levels marked at 70 and 30, respectively. Shorter or longer timeframes are used for alternately shorter or longer outlooks. More extreme high and low levels--80 and 20, or 90 and 10--occur less frequently but indicate stronger momentum.
Divergence差异
Wilder further believed that divergence between RSI and price action is a very strong indication that a market turning point is imminent. Bearish divergence occurs when price makes a new high but the RSI makes a lower high, thus failing to confirm. Bullish divergence occurs when price makes a new low but RSI makes a higher low.
Overbought and oversold conditions
Wilder thought that "failure swings" above 70 and below 30 on the RSI are strong indications of market reversals. For example, assume the RSI hits 76, pulls back to 72, then rises to 77. If it falls below 72, Wilder would consider this a "failure swing" above 70.
Finally, Wilder wrote that chart formations and areas of support and resistance could sometimes be more easily seen on the RSI chart as opposed to the price chart. The center line for the relative strength index is 50, which is often seen as both the support and resistance line for the indicator. If the relative strength index is below 50, it generally means that the stock's losses are greater than the gains. When the relative strength index is above 50, it generally means that the gains are greater than the losses.
Uptrends and downtrends
In addition to Wilder's original theories of RSI interpretation, Andrew Cardwell has developed several new interpretations of RSI to help determine and confirm trend. First, Cardwell noticed that uptrends generally traded between RSI 40 and 80, while downtrends usually traded between RSI 60 and 20. Cardwell observed when securities change from uptrend to downtrend and vice versa, the RSI will undergo a "range shift."
Example of RSI Indicator Divergence
Next, Cardwell noted that bearish divergence: 1) only occurs in uptrends, and 2) mostly only leads to a brief correction instead of a reversal in trend. Therefore bearish divergence is a sign confirming an uptrend. Similarly, bullish divergence is a sign confirming a downtrend.
Reversals
Finally, Cardwell discovered the existence of positive and negative reversals in the RSI. Reversals are the opposite of divergence. For example, a positive reversal occurs when an uptrend price correction results in a higher low compared to the last price correction, while RSI results in a lower low compared to the prior correction. A negative reversal happens when a downtrend rally results in a lower high compared to the last downtrend rally, but RSI makes a higher high compared to the prior rally.
In other words, despite stronger momentum as seen by the higher high or lower low in the RSI, price could not make a higher high or lower low. This is evidence the main trend is about to resume. Cardwell noted that positive reversals only happen in uptrends while negative reversals only occur in downtrends, and therefore their existence confirms the trend.
MACD - EMA
Exponential moving averages highlight recent changes in a stock's price. By comparing EMAs of different periods, the MACD line illustrates changes in the trend of a stock. Then by comparing that difference to an average, an analyst can chart subtle shifts in the stock's trend.
Since the MACD is based on moving averages, it is inherently a lagging indicator. As a metric of price trends, the MACD is less useful for stocks that are not trending or are trading erratically.
signal = EMA[period,9] of MACD
histogram = MACD – signal
The upwards move is called a bullish crossover and the downwards move a bearish crossover. Respectively, they indicate that the trend in the stock is about to accelerate in the direction of the crossover.
The histogram can also help in visualizing when the two lines are approaching a crossover. Though it may show a difference, the changing size of the difference can indicate the acceleration of a trend. A narrowing histogram suggests a crossover may be approaching, and a widening histogram suggests that an ongoing trend is likely to get even stronger.
While it is theoretically possible for a trend to increase indefinitely, under normal circumstances, even stocks moving drastically will eventually slow down, lest they go up to infinity or down to nothing
The MACD is only as useful as the context in which it is applied. An analyst might apply the MACD to a weekly scale before looking at a daily scale, in order to avoid making short term trades against the direction of the intermediate trend.Analysts will also vary the parameters of the MACD to track trends of varying duration. One popular short-term set-up, for example, is the (5,35,5).
Like any indicator, the MACD can generate false signals. A false positive, for example, would be a bullish crossover followed by a sudden decline in a stock. A false negative would be a situation where there was no bullish crossover, yet the stock accelerated suddenly upwards.
A prudent strategy would be to apply a filter to signal line crossovers to ensure that they will hold. An example of a price filter would be to buy if the MACD line breaks above the signal line and then remains above it for three days. As with any filtering strategy, this reduces both the probability of false signals as well as the frequency of missed profit.
The MACD has often been criticized for failing to respond in very low or alternately very high volatility market conditions.Since the MACD measures the divergence between averages, it can only give meaningful feedback as trends change. Thus, the MACD is less useful if the market is not trending—trading sideways or trading erratically—making sudden, dramatic, and/or countervailing moves.
In a sideways market, the divergence between averages will not have a trend to illuminate. In an erratic market, the changes will happen too quickly to be picked up by moving averages or will cancel each other out, diminishing the MACDs usefulness. A partial caveat to this criticism is that whether a market is trending or volatile is always relative to a particular timeframe, and the MACD can be adjusted to shorter or longer spans.
Finally, though some analysts trade on technical indicators alone, the abundance of experts recommend a complete work-up of a company's business sectors, financial strength, past earnings, new products, management, and institutional buying. For more traditional investors, an indicator like the MACD may be used only to support a previously determined stock choice, or to select an ideal entry-point into a fundamentally sound stock
Wednesday, September 8, 2010
论势篇 - 九
第一个C是Clarity(清晰),即目标要明确。
第二个C是Competence(完美)。
第三个C是Constraint(约束)。
第四个C是Creativity(创意).
第五个C是Concentration(专注)
不要只是许愿(wish)与空想(hope),而要让事情发生(make it happen)。俗话说:”君子立志长,小人常立志。”不少人常常立志,差不多每年春天都立志,但到每年秋天都忘了。
第六个C是Courage(勇气)。
最后一个C是Closure(结束),即训练自己在限期之内完成任务。例如阁下的目标是用5年时间赚取第一桶金,然后再用5年时间将1桶金变成2桶金、4桶金、8桶金,以每5年一倍的速度上升。因为人类天生有惰性,如无时间限制便不能达标,所以要制定目标并限时完成。如果需要花上一生时间才赚到第一桶金,用处已经不大。
Tuesday, September 7, 2010
Allianz
Abstract information from one of the investor from forum
http://www.investalks.com/bbs/viewthread.php?tid=3299&extra=page%3D4
ALLIANZ 股数: 153.869million
ALLIANZ -ICPS股数: 192.336million
去年业绩 net profit : 118.857million
EPS = 118.857/153.869=77.25sen
PE = RM3.7/RM0.7725 = 4.8
(If all ALLIANZ-ICPS converted after 1 year)
Estimate Deluted EPS = 118.857/346.205 = 0.343
Estimate Deluted PE = RM3.7/RM0.343=10.8
Current price
pe = 4.15/0.7725 = 5.37
Assume EPS remain same due to economy slow down and pe 7
Thus
7 x0.343 = 2.4
Company Presentation Q1 2010
https://www.allianz.com.my/cls/index_b4.aspx?t=1508#top
ALLIANZ (1163) 是一家保险公司, 有两种业务. 第一种是普险, 第二种是人寿险.
最近它为了解决母公司上次借它的RM490million, 发行优先股跟股东讨钱. 预料这次优先股可以筹到RM611million
每100股ALLIANZ会分配到125股的ALLIANZ-PR(是一种right)
ALLIANZ-PR最后一天自由交易是星期四 15/7/2010
每股ALLIANZ-PR要还RM3.18 来convert 变 ALLIANZ-ICPS优先股.
ALLIANZ-ICPS将在8月6日上市.
ALLIANZ-ICPS优先股 的好处:
如果ALLIANZ打算发股息, 比例一定是 ALLIANZ-ICPS 1.2 : 1 ALLIANZ普通股 (ALLIANZ-ICPS会收到比普通股更多的股息)
ALLIANZ-ICPS可以在一年过后免费转为ALLIANZ(如果ALLIANZ-ICPS拥有者想要这样做) (所以1年以内ALLIANZ不会有EPS delution)
坏处是: ALLIANZ-ICPS没有投票的权利.
感觉ALLIANZ 德国母公司很支持ALLIANZ Malaysia 一下.
上次免息借RM490million收购COMMERZ INSURANCE
这次如果有股东不要subscribe RM3.18 ALLIANZ ICPS, ALLIANZ母公司愿意subscribe完.
BNM有要求ALLIANZ保持最多75%股权. 所以就算ALLIANZ买完全部ALLIANZ ICPS它也不能乱Convert.
ALLIANZ印象中有停牌过. 原因是ALLIANZ 德国母公司拥有98%股权太高了. 所以它把大约24%卖给Fund, 只剩下75%, 之后ALLIANZ又重新买卖.
ALLIANZ 2007年花了RM490million买了COMMERZ INSURANCE, 而且跟CIMB签了10年Contract可以利用CIMB平台卖保险. 感觉有点像LPI+PBBANK. Detailed Contract还没研究. 2008年不太赚钱部分原因是要Write Down COMMERZ INSURANCE里的烂帐.
ALLIANZ人寿险部分开始对公司有贡献. 以前ALLIANZ要输入投资进人寿险子公司. 现在人寿险子公司2009年度贡献了RM12million.
股权方面:ALLIANZ SE有74.97%前46大股东有94.56股权. Free Float5.44%
From 2nd brother .
Allianz 的 appraisal change Allianz,
最近买入了这间公司。有朋友问说,它也不怎么样 undervalue,underwriting 也不是非常出色,dividend 也很低,怎样看都不是很值得??保险公司是我一路以来都有留意的行业。打从10 年前看了评述 warren buffett 的书后,就买了 P&O 和 LPI,也曾买过 Kurnia Asia。亏过也赚过。这行业的重点是管理层,只有好的管理层才能创造价值。从cimb 那里买入普险业务后,跟母公司借了 490 Mil。问题也从这里开始,虽然是零利息的贷款。还有就是 bank negara 对资本要求的提高。为了解决这问题, Allianz 通过优先股筹了 611 mil。那又有什么卖点呢?是 appraisal change。通过优先股,它解决跟母公司的贷款 和 bank negara 对资本要求。从现在开始,它的盈利都可派发给股东。还有它的管理层也不差,形象会改变!
TOPGLOVE part2
Highest price during this period is 14.54 on 15-Jul-2010
Lowest price during this period is 5.81 on 7-Sep-2010
Price Before Split 14.48 15 Jul
Price After Split 7.22 16 Jul
Current Price 5.84
5.84 x 2 = 11.68
Assume last 4 quater = 85cents
Thus
PE = 11.68 /0.85 = 13
Lets see if i able to wait till pe 7 .
pe=7
7=(x(2)) /0.85
x=5.95/2
5.95 /2 = 2.975
Harta
Highest price during this period is 8.55 on 29-Jul-2010
x= 0.65 x 7
= 4.55 (2/3)
Good news = Output expansion
Good news = Cheaper oil
Bad news = Ringgit Stronger
Bad news = USD Depreciate Fast
Bad news = Economy Uncertainty
Bad news = Weak US Market spending
Monday, September 6, 2010
曹仁超说财富
买股票应该是他的业余爱好。1969年,他拿自己辛苦打工赚来的5000元港币买股票。41年后的今天,他拥有42亿元的资产。世界上报人不少,能当专栏作家的不多;股评人不少,能实践买股票发财的不多;报人写专栏股评买股票而又发大财的人,更是少上加少。曹仁超是笔名,意为“超人曹”。从被人嘲笑的低点一直“飞”到众人仰望的高峰。也许,他真的就是“超人”。贫民窟里尽受艰难屈辱
高中毕业时,曹仁超曾老实地说自己的志向就是“赚大钱”,结果引来了同学们哄堂大笑.曹仁超常被称为“平民窟走出的股神”,其实这位“股神”有过一个富裕的家族。他的祖父是英美烟草公司在中国的总代理,是大上海一个买办。解放前夕,因为厌恶国民党的统治,祖父选择了留在上海。
1947年,曹仁超出生在上海,正赶上了时代巨变。1950年,朝鲜战争爆发,国际形势变化莫测。为了“避风头,看形势”,祖父安排曹仁超一家前往香港。但到了香港情况更糟。几年后父亲中风,半身不遂,在曹仁超11岁时,父亲病故。祖父思想老派,担心儿媳妇带着家产嫁人,收回了曹仁超父亲在香港的股票。
母亲带着3个儿女和1万元存款开始艰难地生活。母亲把家搬到了工厂林立的香港土瓜湾,又找了份工作,省吃俭用供三兄妹读书。曹仁超后来回忆说:“家里的钱不能有丝毫浪费。那时我们每天只能花5毛钱,几乎每餐都是一碗鸭血、半斤豆芽、两块豆腐,只有周六才能享受一份人间美味———荷包蛋。”
曹仁超发达后,常有富豪约他吃饭。但如果要去高档法国餐厅吃鸭血,曹仁超“打死都不去”。因为贫穷,曹家常遭人的白眼。据说,曹家邻居阿婶丢了一颗金子,不分青红皂白就说是曹仁超偷的。后来金子找到了,她也不道歉,反而对曹仁超说:“你那么穷,偷东西是迟早的事!”
高中毕业时,曹仁超曾老实地说自己的志向就是“赚大钱”,结果引来了同学们哄堂大笑。曹仁超受不了这种遭人轻视的生活,中学毕业后即闯荡社会,把读书的机会留给弟妹。他的弟弟,后来成为在香港很受人尊敬的港大医学院名教授。
1969年,他用5000元买股票,3年下来,赚了28万元.很多上海企业家和曹家一样,在解放初期南迁香港,纺织业成为上海人集中的行业。曹仁超找工作自然就进了纱厂,随后又转到假发厂。上世纪70年代的香港,工厂劳动条件也很艰苦。曹仁超常常要在摄氏40多度的高温里光着膀子,穿着大裤衩干活,蹲在地上吃盒饭,一天挣不到多少钱。曹仁超觉得这样在工厂里上班看不到希望。
推荐阅读
这时,他结识了一位女孩。他感觉这个温柔的女孩很像自己的母亲,于是他对女孩说:“我现在开始追你,追到娶你为止。”女孩被打动了,答应做他的女朋友,但条件是他不能在工厂做工,要找一份穿西装的体面工作。经朋友的介绍,曹仁超进入一家证券公司,先干学徒,从擦桌子、打开水做起,月薪220港元。为了实现自己“赚大钱”的抱负,一天的工作结束后,他还兼职帮别人打英文信,一封信4元,每天打5封。就这样,他一年下来存了5000港元。
1969年,他用5000元买股票,3年下来,赚了28万元。手气之好,让这个20岁的年轻人志得意满。曹仁超说:“那时候交易制度不健全,买进后可以立刻卖出,但两周后才须交割款项。我往往在买进1小时后卖出,就能赚钱,最高曾经同时握有100万元的股票,但其实手上只有1万元现金。”
然而,风险也在等着他。1971年,他结识了一位华人探长,刚好这位探长收受了不少贿金,正寻求洗钱通道。探长让曹仁超帮他洗钱,开出非常优厚的条件,除了数十万的年薪,还赠送他豪宅跑车。曹仁超同意与探长合作,成立了一家投资公司。母亲知道后,非常生气,骂他说:“教出你这种不肖子,我要跳楼自杀!”
曹仁超被母亲一骂,头脑也清醒了,他连夜找到那个探长要求辞职。但探长凶相毕露,坚决不允。后来双方约在酒楼谈判,探长带着几名彪形大汉前往,指着曹仁超说:“你永远别想脱身!”曹仁超不知怎么办才好,曹母却走进来,手握菜刀大吼道:“不让他退出,就砍死你们!”探长没想到会碰上这样的场面,一时愣住了。曹仁超这才脱身离开。从此,他把这件事作为终身教训,告诫自己要一辈子脚踏实地做事。
林山木很惊讶,说他是“超人”,于是给他起了笔名曹仁超,意为“超人曹”
推荐阅读.曹仁超供职的证券公司有很多年报,都是英文的。曹仁超英语很好,经常拿报表看,了解了很多资讯。再和客户交谈,就能为客户解答许多问题。后来他觉得把这些问题写成文章发表出去,可以帮助更多的人,自己也能挣稿费。
于是,他开始给报社投稿,最终得到《明报晚报》编辑林山木的赏识。曹仁超记忆力极好,对财报中的数据过目不忘。林山木很惊讶,说他是“超人”,于是给他起了笔名曹仁超,意为“超人曹”。林山木后来开创了香港最好的财经报纸《信报》。几年后曹仁超追随而至,入股5%。之后,林山木的政经专栏和曹仁超的“投资者日记”专栏成为《信报》的两大品牌栏目。
这期间,曹仁超投资股市却遭遇两次惨痛的失败。1971年,中国恢复联合国席位,曹仁超判定这是大好时机,当时他已经拥有20多万元资产,又借了20多万元港币,全部投入,没想到3个月就亏得只剩下8000元港币。遭遇平生最大打击,曹仁超倒还沉得住气。他的理念是:明朝再来过。趁年轻博一把,反正身家也不大。结果一年多之后,曹仁超运气重来,身家涨到50多万港币。那时候香港普通人每月薪金只有300港币。但是,赔也好,赚也好,当时差不多全是蒙的。他觉得这样不行,于是定下心学习,读了很多关于股市技术分析方面的书籍。然而,人算不如天算。长了知识,掌握不了世界形势。不久,中东石油危机爆发,全球经济衰退,恒生指数由1775点狂跌至150点,跌幅达91.55%。当时他选中和记企业,从每股8港元开始一直加仓,不料竟然跌到了1港元。曹仁超投资的50万港元变成了10万港元,所在公司也破产了。那天晚上他漫无目的地徘徊在海边,差点儿想自杀。等到次日早晨回家时,母亲和妻子眼泪汪汪地看着他。当时曹仁超发誓,在自己的有生之年,再不容许同类事件发生。
“只要按我的方法行事,任何人都可以赚到一个亿。”曹仁超有时这样说.几经股市磨难后,曹仁超总结出了自己的方法———“把准趋势,追涨杀跌。”新的思路让他获得了丰富的回报。1997香港回归之前,他看好香港房地产,购入大量地产股,最终赢得30倍以上的回报。
在挑选股票时,他独创了“牛眼投资法”。他认为,在把握市场大趋势的前提下,挑选在一段时间内具有潜力的行业,再从中挑选升幅潜力较大的二线股。理论上,5年内只要射中牛眼6次,每次获利100%以上,就算最初只有万元本金,也可以获利百万元。曹仁超还认为要学会止损。他说:“止损也许会错过了赚大钱的机会,但是它令你不会再一次失去大部分的财产。”还要会“追涨”,即是不要轻易言退,只要坚持就能赚取最大利润。
有一次,他从媒体上看到胡锦涛主席支持造船业,就在1元的价位买了中华造船业股票,结果赚了两倍。之后他很开心地离开,但后来发现离开早了。“如果继续持有,可以赚大约25倍。”他说。
在他看来,投资股市如同打仗一样,先要做好调查,看准大趋势,并制定战略,充分运用技术分析和基础分析,再配合眼前形势,临危不惧,方能胜出。
“只要按我的方法行事,任何人都可以赚到一个亿。”曹仁超有时这样说。但他也说过:“不要把我当成‘股神’,神在天上呢,我只是顺势而为。”“我所讲的投资方法未必适合你,不要照搬。”事实上,曹仁超就是一个例外。
“我的成功可以复制”的说法基本上是忽悠人的。任何人都不可复制,更何况“超人”。没在股市上赚到钱不能总是怨天尤人,投资是一场战争,你相信战争的胜负全凭运气吗?好的开始是成功的一半,进入股市前,必须要有周详的计划,不靠匹夫之勇,更不靠运气。投资之前,要谨记“狠、忍、准”三大要诀,事前分析大势,形势有利时,进攻要狠,形势不利时要忍。我认为只有身家过亿的人才有资格分散投资,散户一定要集中火力,才有机会赚大钱,把鸡蛋放在太多篮子里,很容易手忙脚乱。
投资者永远要记着“买什么、何时买、买多少、何时卖”,要么赚100%以上、要么便15%止损离场。所谓兵贵神速,股市用兵应速战速决,有机会便全力进军,在最短时间内赚取最大利润。我就是一个散户!没有研究团队、不认识庄家大鳄。阅读财务报表也是成功投资者必做的功课,我觉得财务报表与武侠小说一样精彩,因为其背后是一家家鲜活的公司。当你把看书、阅读财务报表当做一种习惯,就离成功投资者很近了。如能找出正确的投资领域,其他一切便变得简单容易了。
有人把自由看做比生命还重要,想实现财务自由,不付出努力,指望购入资产、长期持有便能一劳永逸,无异于痴人说梦。世间财富分配永远是二八分化状态,要想成为那20%,就要勇敢地抓住趋势,在不断实践中取得成功。
我主张趋势投资,也是尽力发挥性格上的优点:热爱求知、是非分明。但我做事欠缺精细、故宁愿捕捉经济与行业大势,绝不强求自己选股能力胜人一筹。巴菲特处事精细,不理会市况去投资,因为他有选股的大智慧,所以他的投资哲学未必适合你我。